Visitor’s Reports & Analytics
Authorized users and integrated systems can use the available APIs to generate detailed reports on visitor activity. These reports provide key metrics, including daily visitor counts, peak visiting hours, repeat visitors, visitor-to-company mapping, and host-wise visitor statistics.
Each report includes multiple configurable options, allowing users to customize the data views as needed.
The below toolbar is available on each report.

Toolbar Icons
- Filter Icon (Funnel)
Use this to apply filters to your report data. You can filter by parameters like date range, user type, or any custom field. - Customize Color (Color Fill)
Click this to apply desired colors to the reports for viewing purpose. - Trend/Graph Icon (Line Graph)
Displays the data in a graphical format, such as line or bar charts, for easier trend analysis. - Zoom In Icon (Magnifying Glass with +)
Zoom in on a specific section of the report for a detailed view. - Zoom Out Icon (Magnifying Glass with -)
Zoom out to see a broader view of the report data. - Legend/Filter View Icon (Switch Button)
Switch the Legend/Filter buttons of or on to view. - Download Icon (Arrow Down)
Export the report in available formats, such as PDF or PNG. - Full Screen Icon (Arrows Pointing Outward)
Expand the report to full screen for better visibility and presentation. - Info/Details Icon (i)
Access Total Visitor’s Report. - Settings/Configuration Icon (Gear)
Customize report settings, such as display options, columns, or chart types. The user can save the custom configuration or reset configuration to default.
Columns can be grouped by dragging the desired column header into the grouping area, as shown in the screenshot below. You can also filter the data in the grid using the available filter options.
Display Overview
The report screen provides multiple visual and tabular insights to help users analyze visitor trends effectively. The following components are available:
- Dual Line/Bar Chart – Displays a comparison of Total Visits vs. Unique Visitors.
- Donut Chart – Shows the distribution of Repeat Visitors (%) vs. First-Time Visitors (%).
- Data Table – Includes the following columns:
- Date
- Total Visits
- Unique Visitors
- Repeat Visitors (%)
View Options-Users can switch between different display formats based on their preference:
- Tabular View – Presents data in a structured table format.
- Graphical View – Offers visual representation through charts for easier analysis.
Export & Print Features- The module provides multiple export and print options:
Export Formats: Excel, CSV, and PDF
Print-Ready Reports: Generate a formatted version suitable for printing.
Additional Functionalities: To enhance the user experience, the following features are included:
- Search functionality for quick data retrieval
- Pagination for easier navigation through large datasets
- Multiple configurable options within each report for customized viewing and analysis
Count Summary (Total Frequent Visitors: X)
This section displays the total number of users who fall under the “Frequent Visitors” category. The value X represents the calculated count based on visit frequency.
Visual Overview: Chart & Table
A combined visual and tabular representation is provided to help users quickly understand visitor activity patterns.
Chart: Illustrates the Top Frequent Visitors ranked by their total visit count.
Table: Presents detailed visit data for each visitor in a structured, easy-to-read format.
There are Chart Options at the corner, there are some facilities for configuration.
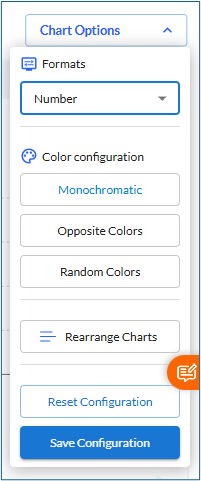
The Chart option gives the user to select various options like the Formats can be in Numbers or Percentage, the colors of the chart can be monochromatic, opposite or random colors, the user can rearrange the charts as per their liking. After setting up the configurations, the user can save it or reset the configuration to default.
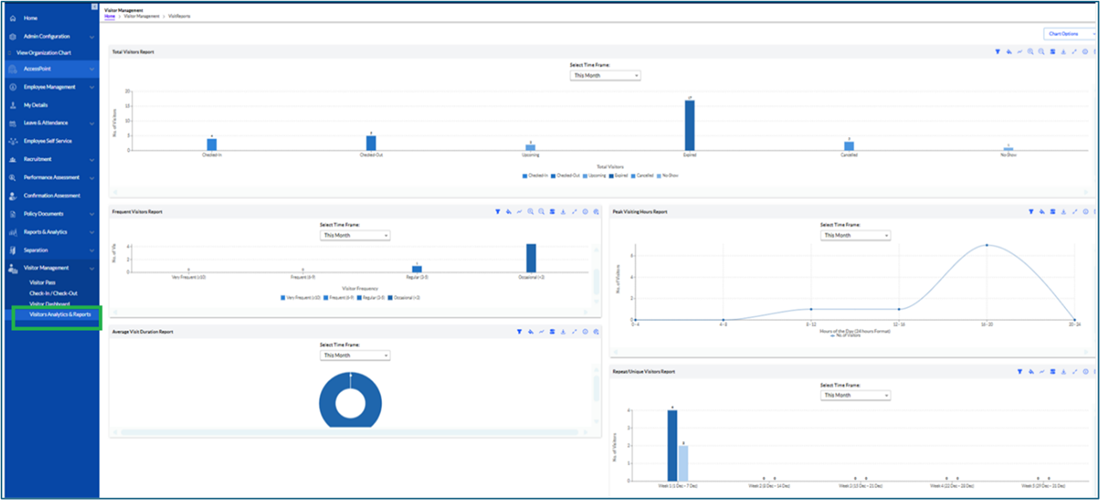
The Visitor’s Reports are of following types-
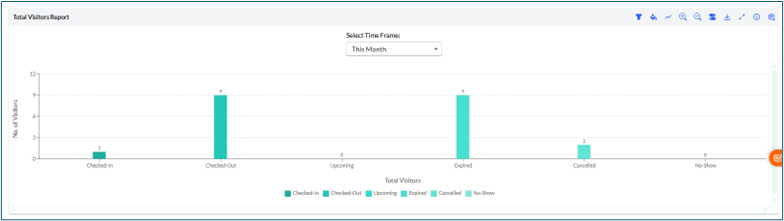
The Total Visitors can be viewed here.
The Total Visitors Report provides a comprehensive overview of visitor activity within the selected timeframe. It displays the number of visitors categorized by their visit status, such as Checked-In, Checked-Out, Upcoming, Expired, Cancelled, and No-Show. This helps administrators understand visitor flow and monitor overall visitor engagement at a glance.
Users can refine the report using the available filters:
- Timeframe Filter: Choose from predefined time periods such as weekly, monthly, or yearly to view visitor statistics based on your preferred duration.
- Date Range Picker: Select a custom date range to analyze visitor activity for a specific period.
This report offers clear, visual insights through bar charts, enabling better planning, resource allocation, and improved visitor management.
The Frequent Visitor Report helps you quickly identify individuals who have visited the premises more than three times. This allows administrators to track recurring visits and monitor patterns effectively.
Users can refine the report using the available filters:
- Timeframe Filter: View data on a weekly, monthly, or yearly
- Date Range Picker: Select a custom date range to analyze visitor frequency for a specific period.
This report provides clear insights into visitor trends and helps in better planning and security management.
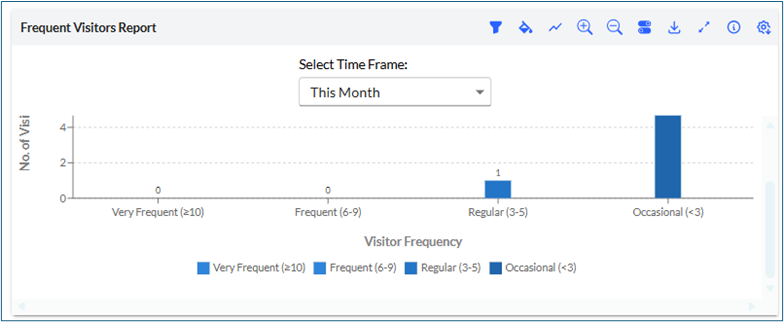
Visitor Categories
Visitors are grouped into categories based on how many times they have accessed the system:
- Occasional: Fewer than 3 visits
- Regular: 3 to 5 visits
- Frequent: 6 to 10 visits
- Very Frequent: More than 10 visits
3. Peak Visiting Hours Report
The Peak Visiting Hours Report helps you identify the hours and days with the highest visitor traffic. This report provides valuable insights into visitor patterns, allowing you to plan resources and staffing more effectively.
Available Filters:
- Timeframe
- Date Range

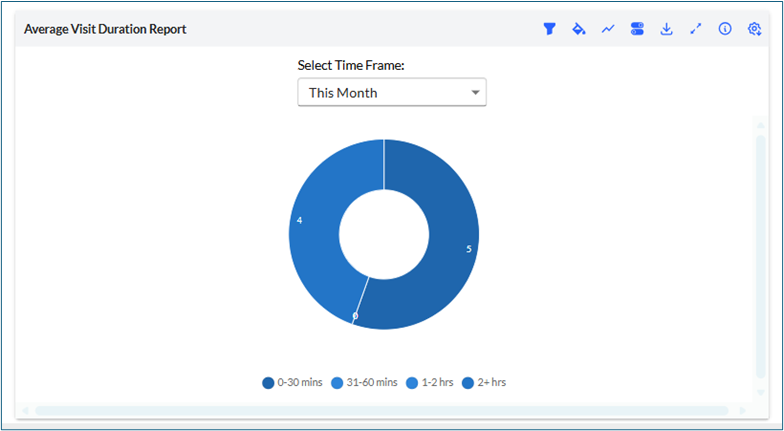
4. Average Visit Duration Report
This report displays the average amount of time users spend on the platform during their visits. It helps you understand overall engagement levels and user interaction depth.
Available Filters:
- Timeframe – Select the period for which you want to view the data.
- Date Range – Specify custom start and end dates to refine the report results.
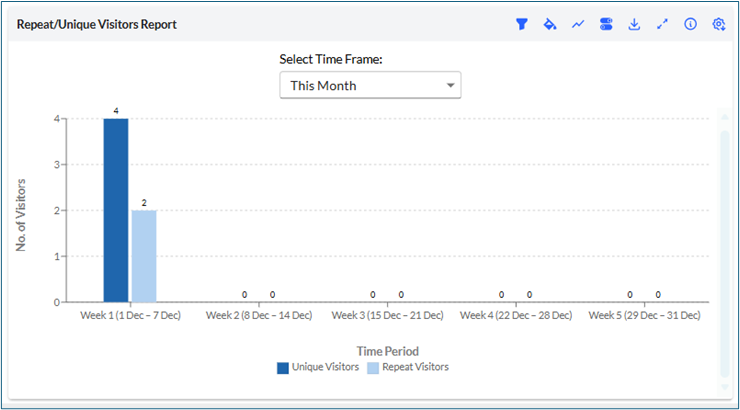
5. Repeat/Unique Visitors Report (Optional)
This report allows you to compare the total number of visits with the number of unique visitors.
You can refine the data using the available filters, including Timeframe and Date Range.