TM - Dashboard
1. Purpose
7. Logged Hours Calculation Rules
- Analyse work distribution across resources
- Track project and resource timelines
- Monitor logged hours and schedule slippage
- Gain quick insights through grouped and expandable summary data
The Dashboard is a read-only analytical view intended for monitoring and reporting.
2. Page Overview2.1 Navigation Path
- Home > Task Management > Dashboard
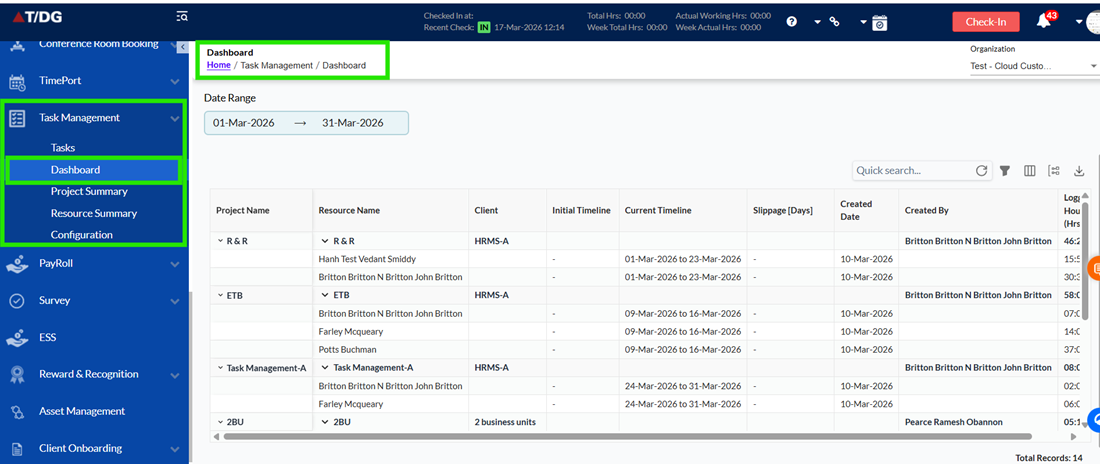
2.2 Page Layout
The Dashboard page consists of:
- A left navigation panel (sidebar)
- A main content area displaying the Summary Grid
- Date range selection controls
- Top-right grid-level action controls
The grid displays summary data based on the selected date range.
3. Date Range Selection3.1 From Date / To Date
- Users can select a date range using calendar dropdowns
- The grid data refreshes automatically based on the selected date range
- Only records falling within the selected range are displayed
3.2 Clear Date Selection
- A Close (X) icon appears next to the selected date range
- Clicking the icon:
- Clears the selected dates
- Resets the grid to its default state
4.1 Grid Behaviour
- The grid presents project and resource-based summary data
- Data can be grouped, filtered, searched, and exported
- The grid supports:
- Expand / collapse rows
- Grouping by Project Name and Resource Name
- Column customization
- Project Name and Resource Name fields include an expand (>) icon
- Clicking the icon:
- Expands to show related child rows
- Collapses to hide detailed data
This allows users to drill down from project > resource > detailed summary.
5.1 Quick Search
- Allows keyword search across all visible dashboard fields
- Includes a Refresh icon to clear the search input
5.2 Filters
- Allows users to apply filters based on available dashboard fields
- Supports multiple filters applied simultaneously
- Includes:
- Add New Filter option
- Remove All Filters option
- Filtered results are reflected instantly in the grid
5.3 Column Visibility
- Opens a dropdown listing all available dashboard columns
- Allows users to control which columns are displayed in the Dashboard grid
- Includes a search option to quickly find columns by name
- Available columns with toggle switches:
5.4 Group Columns
- Allows grouping the grid data by:
- Project Name
- Resource Name
- Supports searching columns within the grouping panel
- Includes a refresh option to reset the grouping search
5.5 Export Options
- Provides Export to Excel functionality
- Exported file reflects:
- Selected date range
- Applied filters
- Grouping
- Visible columns
| Field Name | Description | Source / Logic |
| Project Name | Displays the project name (e.g., HRMS) with expand/collapse support. | Project master |
| Resource Name | Displays resource or team member names with expand/collapse support. | Task assignment |
| Client | Displays the client or engagement type associated with the project. | Project master |
| Initial Timeline | Displays the planned start and end dates of the task or project. | Planned data |
| Current Timeline | Displays the actual start and end dates based on execution. | Task execution |
| Slippage (Days) | Displays the difference between actual end date and planned end date. | System calculated |
| Created Date | Displays the date when the module/task was created. | System |
| Created By | Displays the user who created the module/task. | System |
| Logged Hours | Displays total hours logged, including individual resource contributions. | Work logs |
- Logged Hours are derived from time entries made by resources
- Values include:
- Individual resource hours
- Aggregated totals at project and group levels
- Totals update automatically based on the selected date range
- When grouped by Project Name:
- Logged hours and timelines are aggregated at the project level
- When grouped by Resource Name:
- Hours reflect resource-specific effort across projects
- Expanded rows display detailed breakdowns beneath grouped rows
- Total Records displayed at the bottom-right corner of the grid
- Indicates the number of records currently displayed based on:
- Date range selection
- Filters
- Grouping
- Dashboards are strictly read-only. No inline editing is permitted
- Date range selection must filter all displayed data dynamically.
- All data is system-calculated and derived from:
- Tasks
- Resource assignments
- Work logs
- Any updates in Task Manager automatically reflect on the Dashboard
- Logged hours are automatically aggregated at project and resource levels.
- Expandable rows reflect hierarchical drill-down from project > resource > detailed summary.
- Filters, grouping, and column visibility are immediately reflected in the grid.
- Exported Excel files must respect:
- Selected date range
- Applied filters
- Grouping
- Visible columns
- Users cannot edit any field in the Dashboard.
- All calculations (slippage, logged hours, timelines) are system driven.
- Expand/collapse behavior must accurately reflect parent-child relationships.
- Filtering and grouping must not break row aggregation.
- Dashboard cannot display data without a valid date range selection (defaults apply).