TM - Resource Summary
The Resource Summary module provides a consolidated, high-level view of resource utilization across projects within the Task Management Module. It helps users understand how resources are allocated and how much effort has been logged over a selected period.
This module is intended for:
- Project Managers
- Team Leads
- Administrators
It serves as both a monitoring tool and a management interface for maintaining resource-project associations.
Important:
- Logged hours are fully system-generated and cannot be edited manually
- This screen does not allow task-level operations or work log modifications
1. Objectives
The module enables users to:
- Monitor resource utilization across projects
- Review total logged hours for a defined time period
- Analyze workload distribution at a summary level
- Manage resource–project associations (based on permissions)
2. Navigation
Home > Task Management > Resource Summary
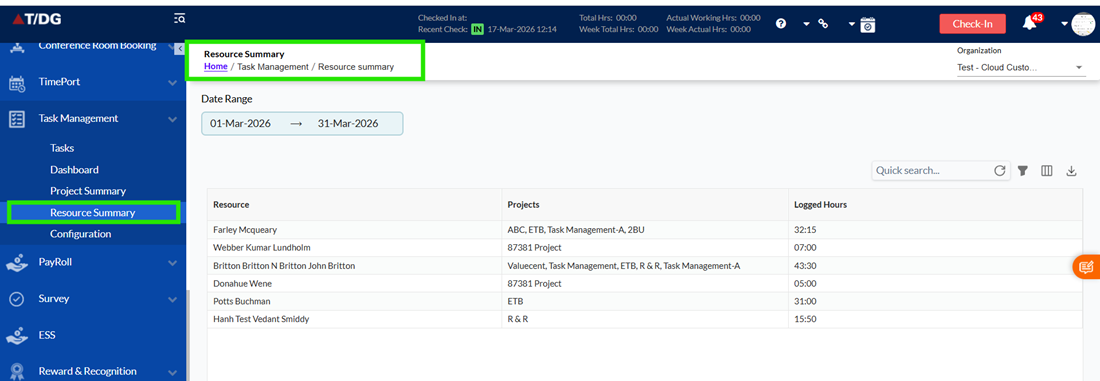
3. Page Layout Overview
The page is divided into the following sections:
- Left Sidebar: Navigation across modules
- Date Range Selector (Top): Defines the reporting period
- Main Grid Area: Displays resource-wise summary
- Top-Right Controls: Search, filters, column visibility, and export
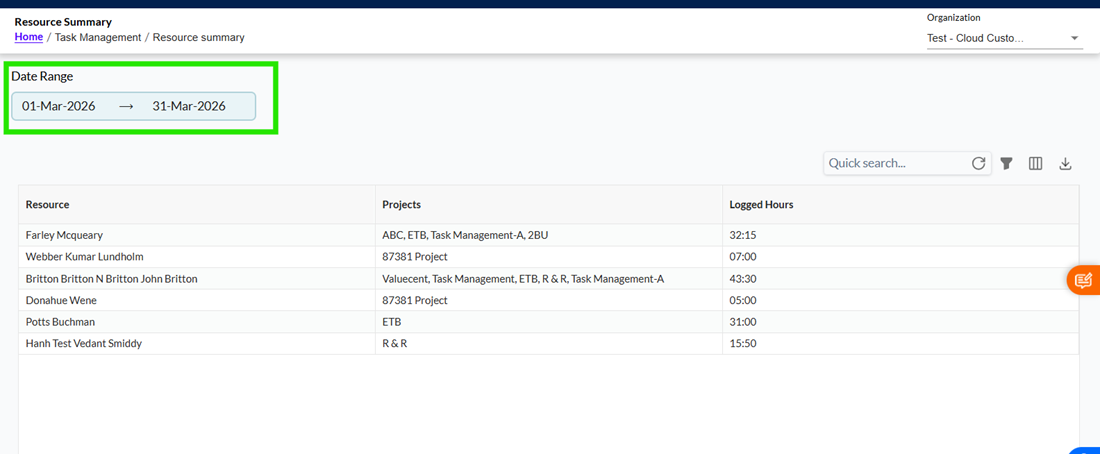
4. Date Range Selection
The date range selector allows users to define the time period for which logged hours are displayed.
Key Features
- Default selection: Current month
- Users can select custom From Date and To Date
- Example: 01-Mar-2026 to 31-Mar-2026
System Behavior
- Logged hours are calculated strictly within the selected date range
- The grid refreshes automatically when the date range is changed
- Only work logs within the selected range are considered; data outside this range is excluded
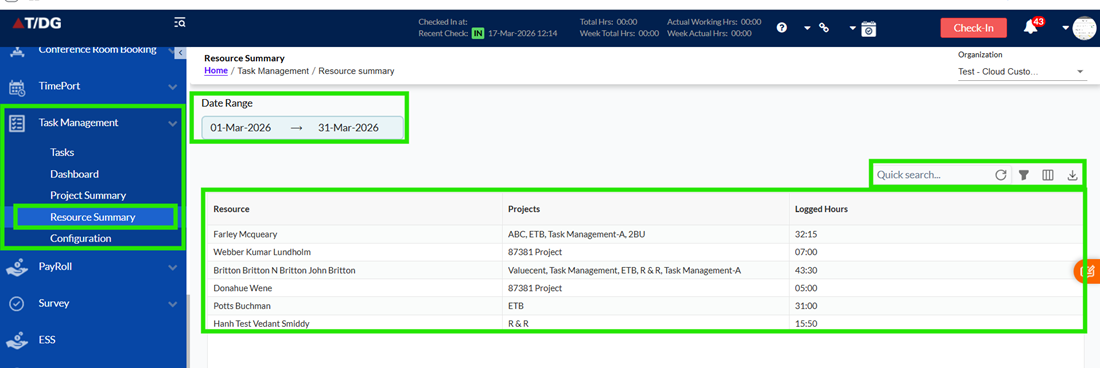
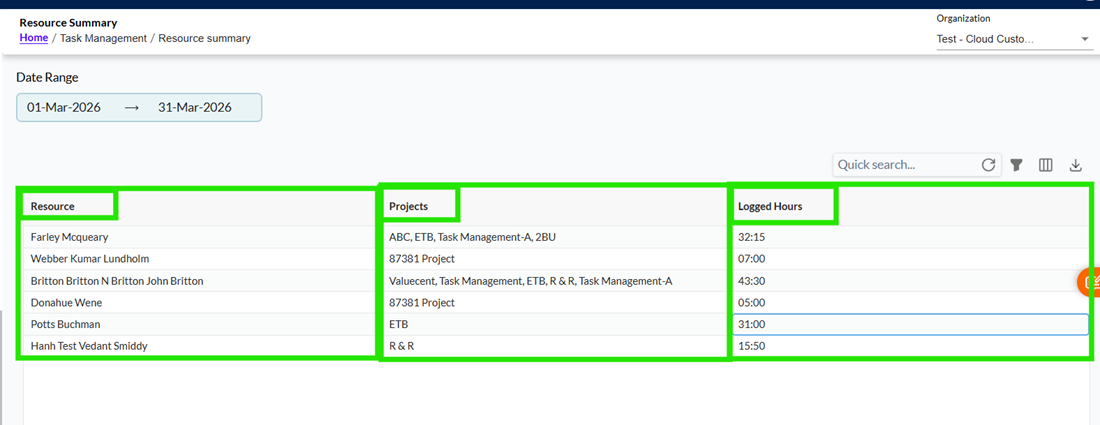
5. Resource Summary Grid
The main grid provides a summary of resource-level data.
5.1 Grid Structure
- Each row represents exactly one resource (user)
- Data is derived from:
- Work log entries
- Task assignments
- Resource–project mappings
5.2 Grid Capabilities
The grid supports:
- Keyword search
- Multi-level filtering
- Column visibility configuration
- Export to Excel
Limitations
- Task-level or individual work-log details are not available in this view
- Users cannot create, edit, or delete work logs from this screen
*Editable based on role-based access control (RBAC)
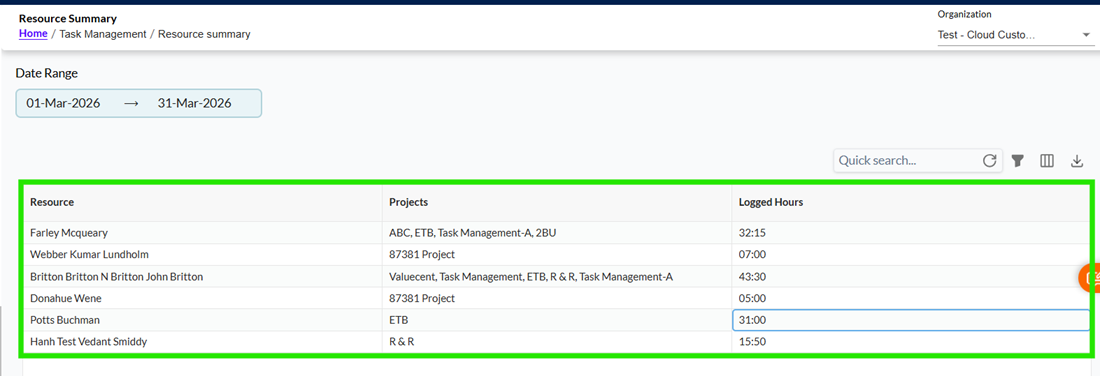
6. Field Behavior and Rules
- Each row must always represent a single resource
- Logged Hours:
- Are automatically calculated by the system
- Are displayed in HH:MM format
- Cannot be edited under any circumstances
- Data shown in the grid is automatically updated based on:
- Work log entries
- Task assignments
- Resource–project mappings
7. Logged Hours Calculation
Logged hours represent the total effort recorded by a resource.
Calculation Logic
- Aggregated across:
- All tasks assigned to the resource
- All projects associated with the resource
- The selected date range
Important Behavior
- Logged hours are strictly system-derived and read-only
- Values are recalculated automatically whenever:
- Work logs are updated
- The date range is changed
- Logged hours always reflect only the selected date range and do not include any data outside it
Constraint
- Logged hours cannot be manually modified from this screen
8. Resource–Project Mapping
The Projects column displays all projects associated with a resource.
Key Features
- Projects are displayed as tags
- A resource can be associated with one or more projects
Editing Behaviour
- Users with appropriate permissions can:
- Add projects
- Remove projects
Important Rules
- Updating project associations:
- Changes only the mapping
- Does not affect logged hours
- Logged hours depend only on actual work log entries, not on project mapping changes
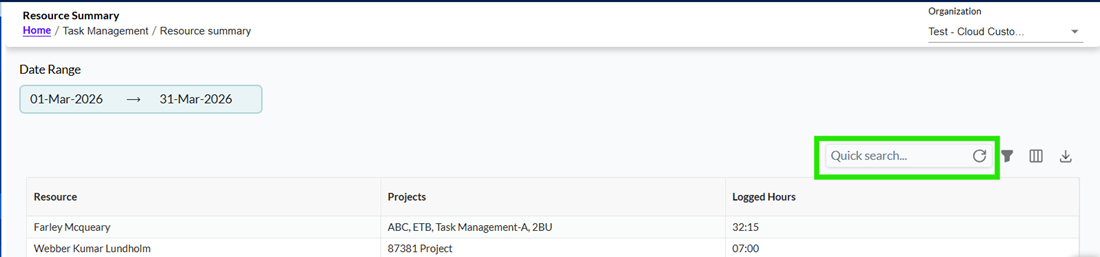
9. Grid-Level Actions
9.1 Quick Search
- Allows users to search across all visible columns
- Includes an option to clear/reset the search
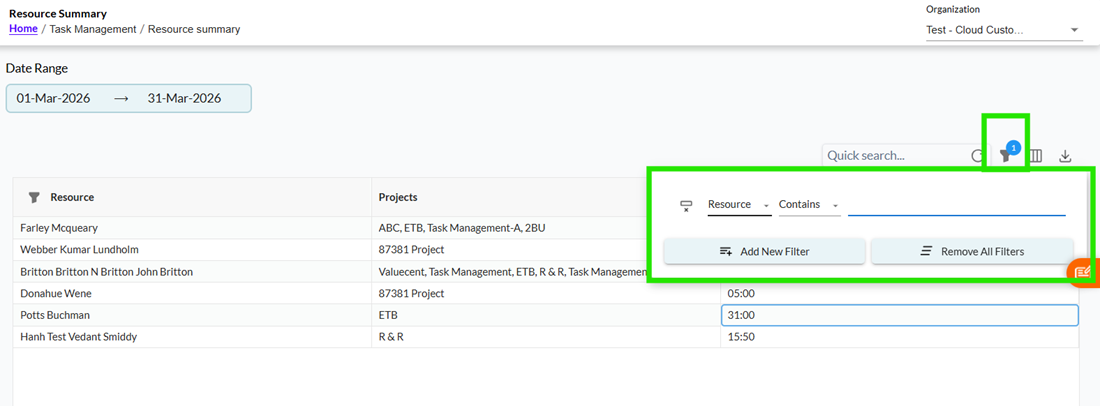
9.2 Filters
- Users can apply multiple filters simultaneously
- Options include:
- Add New Filter
- Remove All Filters
Behavior
- Filter results are applied instantly to the grid
- The displayed data always reflects the active filters
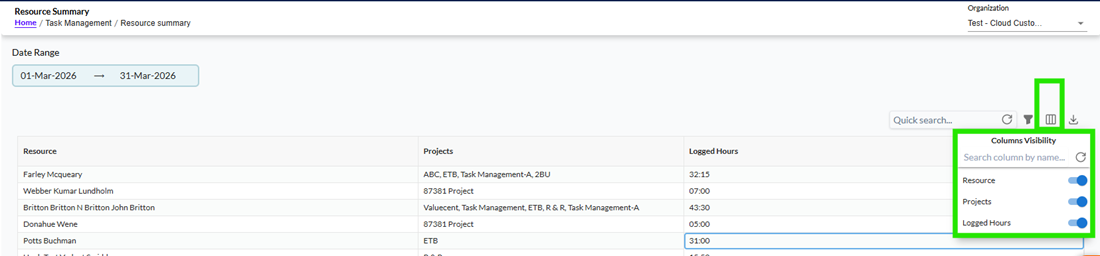
9.3 Column Visibility
Allows users to control which columns are displayed.
Available Columns
- Resource
- Projects
- Logged Hours
Toggle Behavior
- ON (Blue): Column is visible
- OFF (Grey): Column is hidden
Important Behavior
- Changes apply immediately without page refresh
- Column visibility affects:
- On-screen grid display
- Exported Excel data
- Showing or hiding columns does not modify, delete, or recalculate any data
Constraint
- Column order is fixed and cannot be rearranged
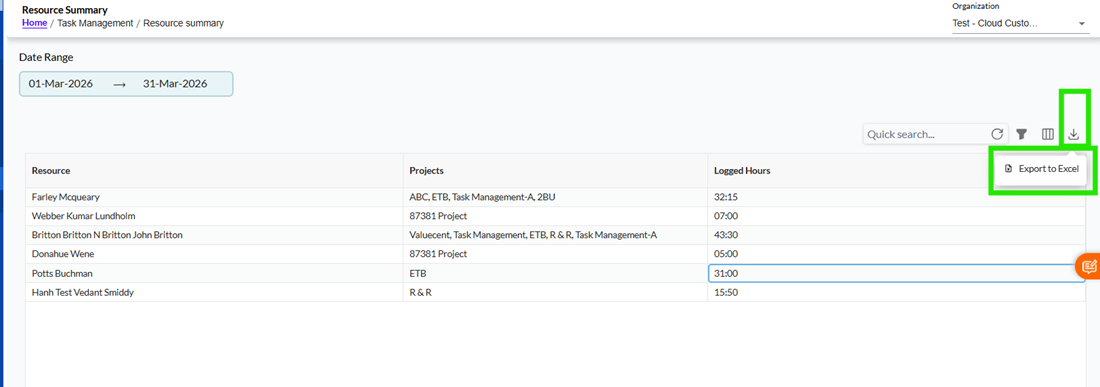
9.4 Export to Excel
Allows users to export the grid data.
Export Includes
- Selected date range
- Applied filters
- Visible columns
- Active search criteria
Important Behavior
- Export always reflects the current state of the grid
- Only the data visible based on filters and column selection will be exported
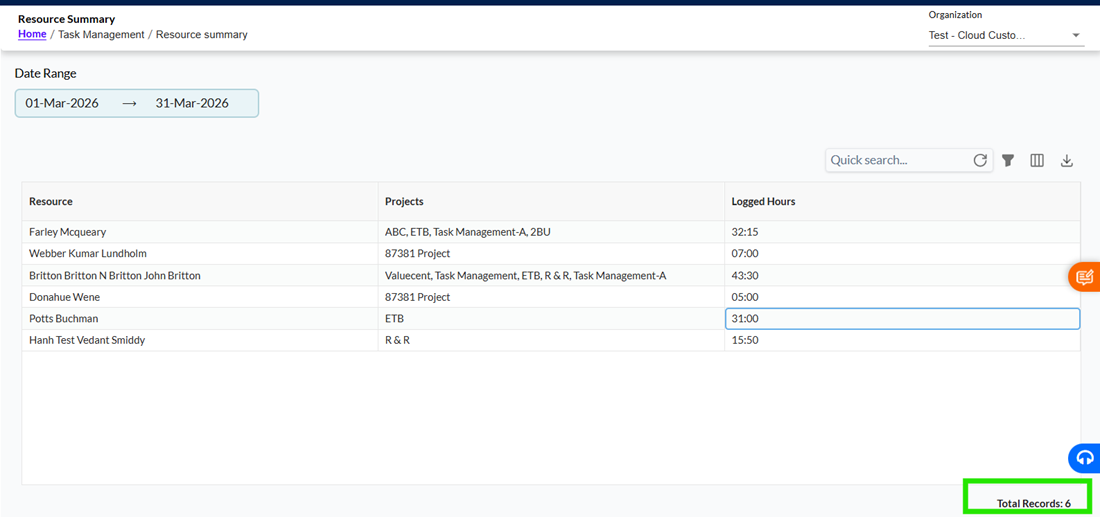
10. Footer Information
The footer displays the total number of records currently shown in the grid.
Behavior
- The count updates dynamically based on:
- Selected date range
- Applied filters
- Search results
11. Access Control
- Data visibility and edit permissions are controlled through role-based access control (RBAC)
Important Points
- Users can only view data they are authorized to access
- Editing of Resource and Projects fields is restricted based on user role
Constraint
- Unauthorized users cannot modify resource or project mappings