
TM - My Work
- Overview
The My Work Dashboard provides users with a centralized view of all tasks assigned to them. It enables users to track task schedules, monitor progress, update work information, log effort, and collaborate with team members from a single location. The dashboard also includes visual reports that help users understand workload distribution based on task priority and work item type. This allows users to efficiently manage their daily activities and stay informed about project progress.
- Navigating the My Work Dashboard
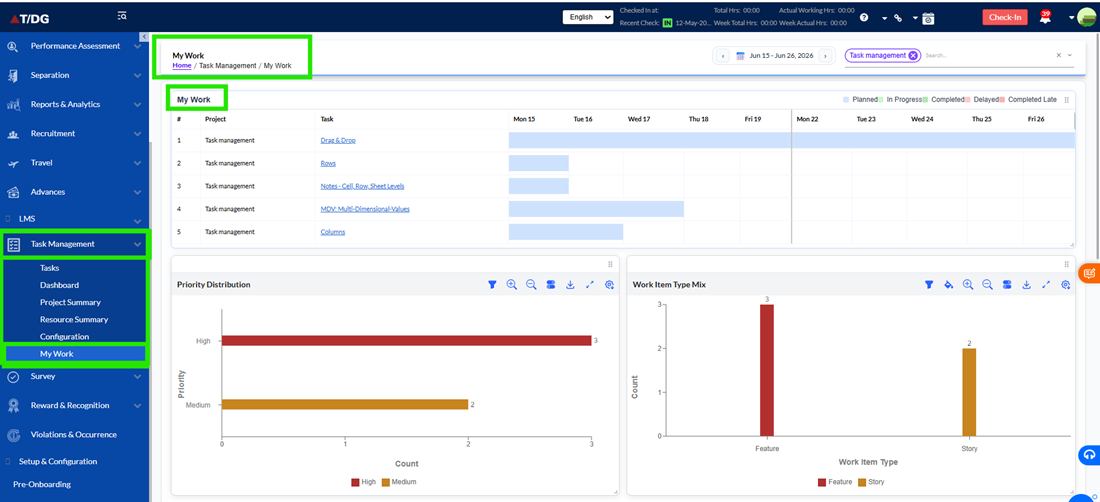
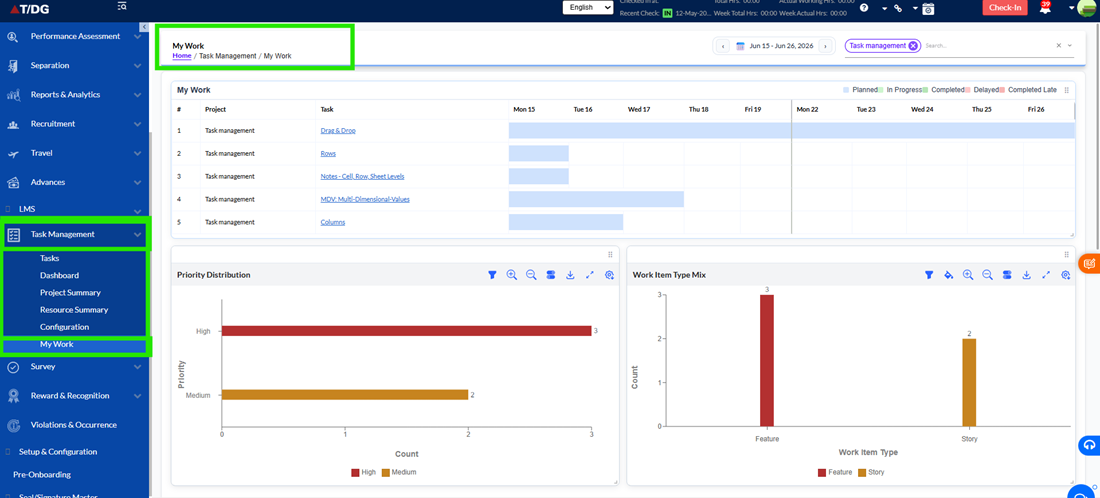
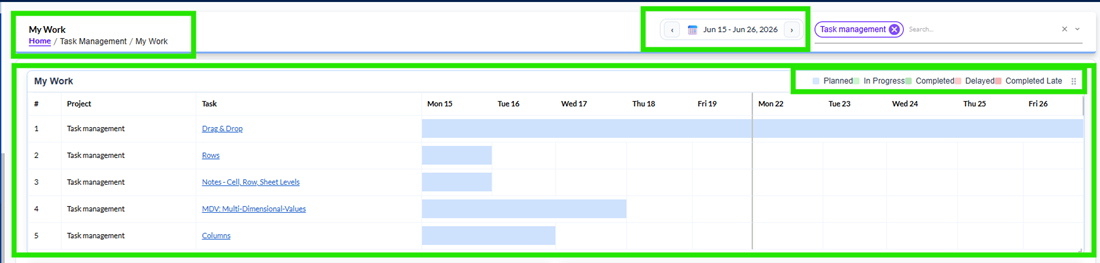
The My Work Dashboard can be accessed through the Task Management module. The breadcrumb navigation displayed at the top of the page helps users identify their current location within the application and navigate back to previous sections when required.
Home > Task Management > My Work
The page title"My Work"confirms that the information displayed on the page relates specifically to the logged-in user's assigned tasks and activities.
- Filtering Tasks
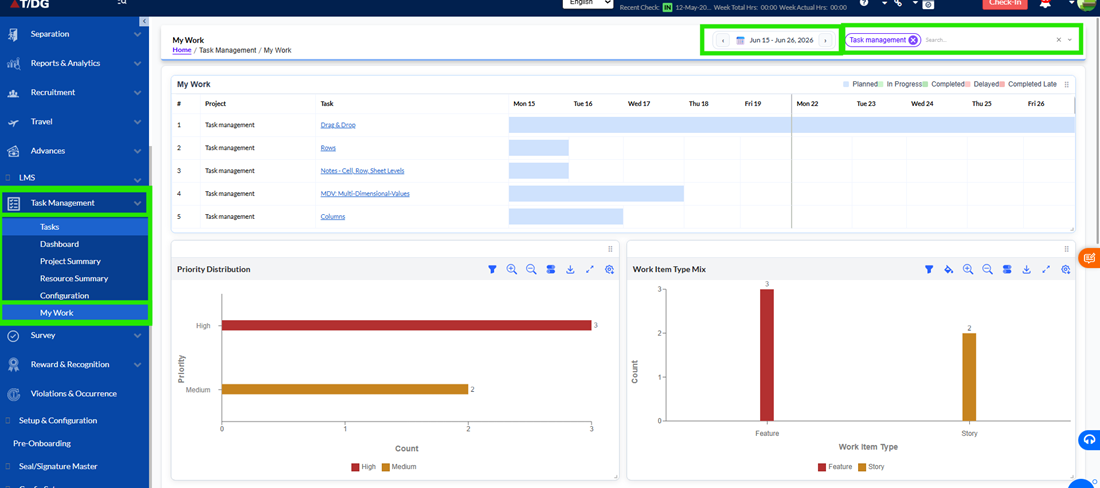
The dashboard provides filtering options that help users focus on relevant tasks and activities. Users can select a specific two-week date range using the navigation controls available at the top of the page. Whenever the date range changes, the dashboard automatically refreshes and displays information relevant to the selected period.
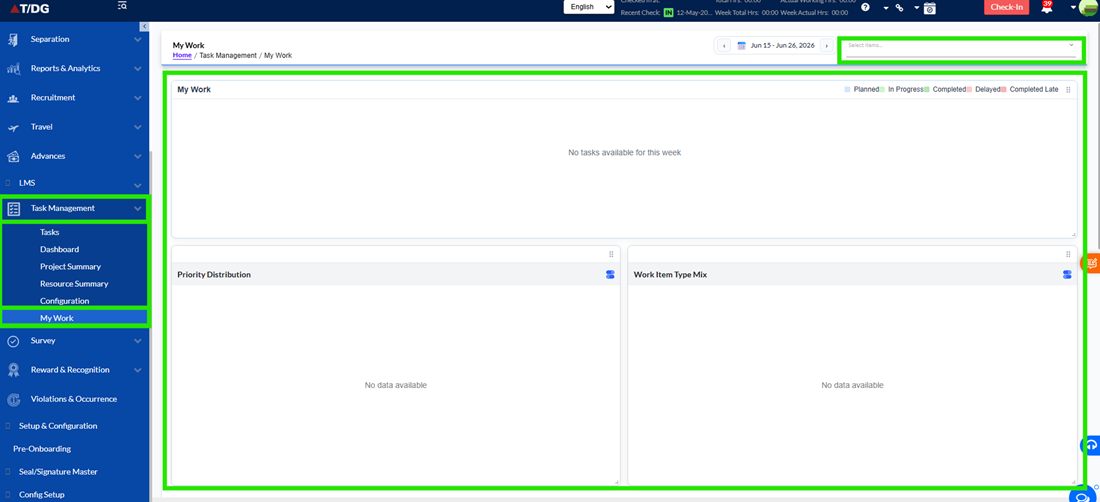
The Project Selector allows users to select one or more projects. After selecting the required projects, the task timeline and analytical charts refresh automatically and display information only for the selected projects.
A project selection is mandatory for viewing dashboard information. If no project is selected, the dashboard displays a"No Data Available"message across all dashboard cards until a valid project selection is made.
- Viewing Assigned Tasks
The My Work section displays all tasks assigned to the logged-in user in a calendar-style timeline view. Each row represents a task, while the timeline visually displays the task duration and progress. Different colours are used to represent task status, helping users quickly identify planned, in-progress, completed, delayed, or completed-late tasks.
The task grid displays important information such as the project name, task name, and scheduled dates. Users can scroll through the grid to view additional tasks if more records are available. Hovering over a task timeline displays additional details such as task status and logged effort.
- Understanding Task Status Indicators
The dashboard uses colour-coded indicators to help users easily identify the current state of their tasks. Planned tasks are displayed in light blue, active tasks are displayed in light green, completed tasks appear in dark green, delayed tasks are highlighted in light red, and tasks completed after the planned end date are shown in dark red. These visual indicators allow users to quickly understand task progress without opening individual work items.
- Opening and Managing Work Items
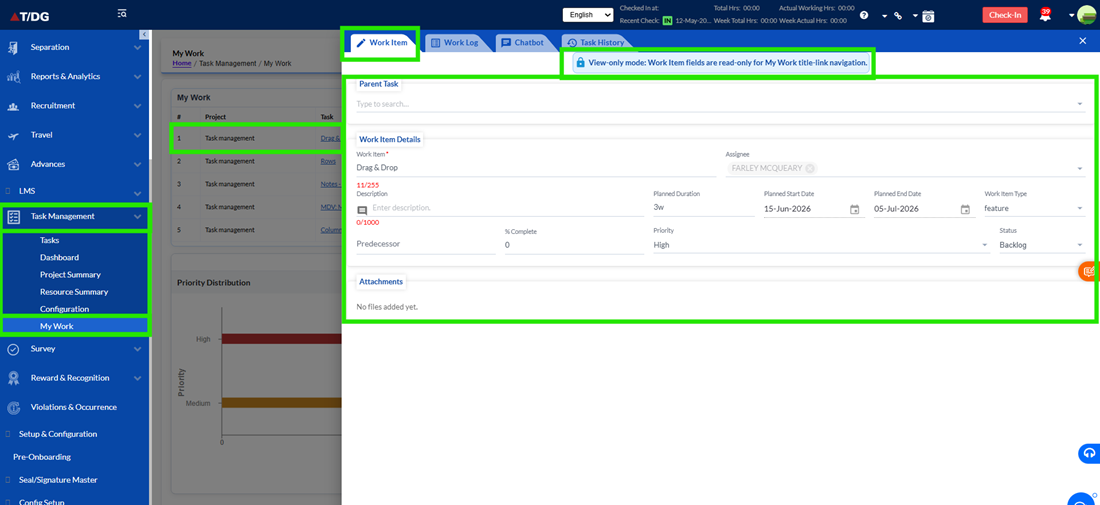
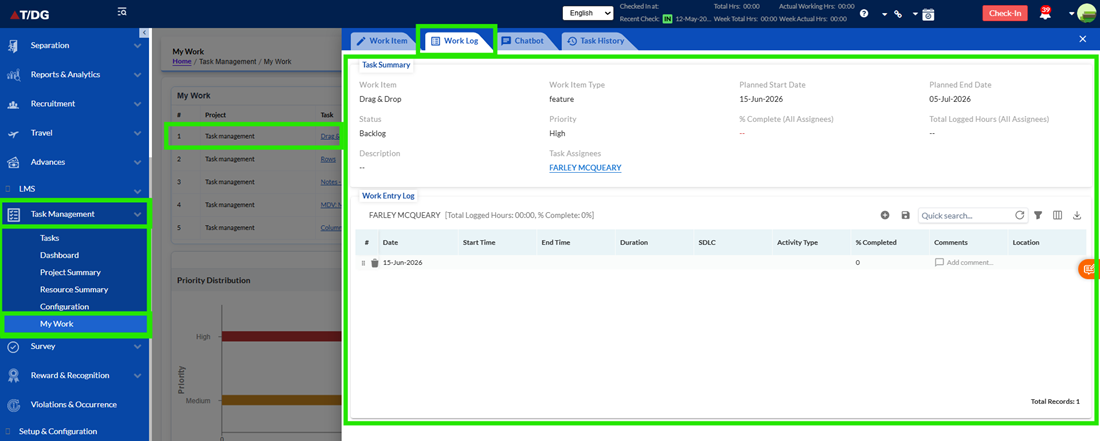
The task name displayed within the task grid acts as a hyperlink. When a user clicks on a task name, the system opens the Work Item Slider Panel from the right side of the screen. By default, theWork Log tabis displayed when the slider opens, allowing users to immediately review effort entries and task-related work information without navigating away from the dashboard.
The slider panel provides access to multiple sections including Work Log, Work Item, Chat, and Task History. Users can switch between these tabs to review different types of information related to the selected task.
When the user selects theWork Item tab, the task details are displayed inRead-Only Mode. Users can view information such as task name, status, planned dates, duration, completion percentage, attachments, and other task attributes; however, no modifications are permitted. Fields remain non-editable and update actions are disabled. This ensures that users can review task information while preventing accidental changes from the dashboard.
- Managing Work Logs
The Work Log tab is the default tab displayed whenever a task hyperlink is selected from the My Work Dashboard. It allows users to review effort logged against the selected task, monitor work progress, and view historical work entries. Users can review work summaries, logged hours, work descriptions, and activity dates associated with the task. The Work Log provides immediate visibility into task effort and progress without requiring users to navigate elsewhere within the application.
- Collaborating Through Chat
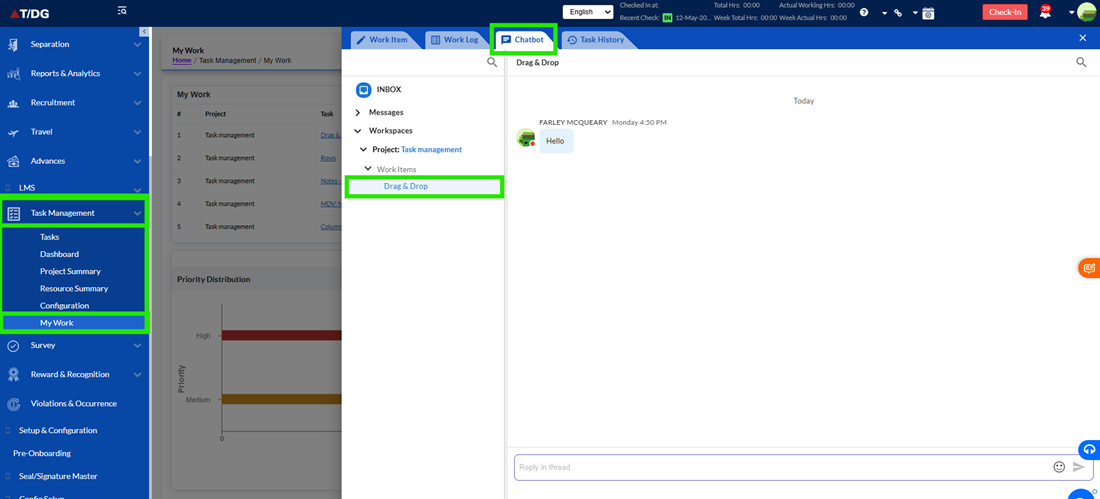
The Chat section enables users to communicate directly with team members regarding a specific task. Conversations remain linked to the selected work item, ensuring that all discussions are maintained in the proper context. This feature reduces dependency on external communication tools and helps teams collaborate more effectively.
- Reviewing Task History
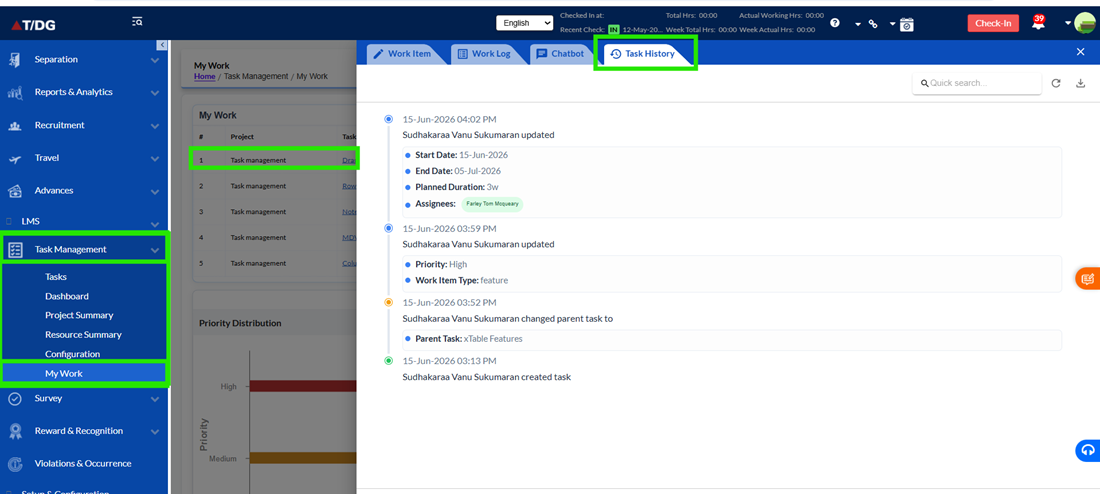
The Task History section provides a complete record of changes made to a work item. Users can review updates, status changes, comments, and other activities performed on the task. This helps maintain transparency and provides visibility into the lifecycle of the work item.
- Monitoring Workload Distribution
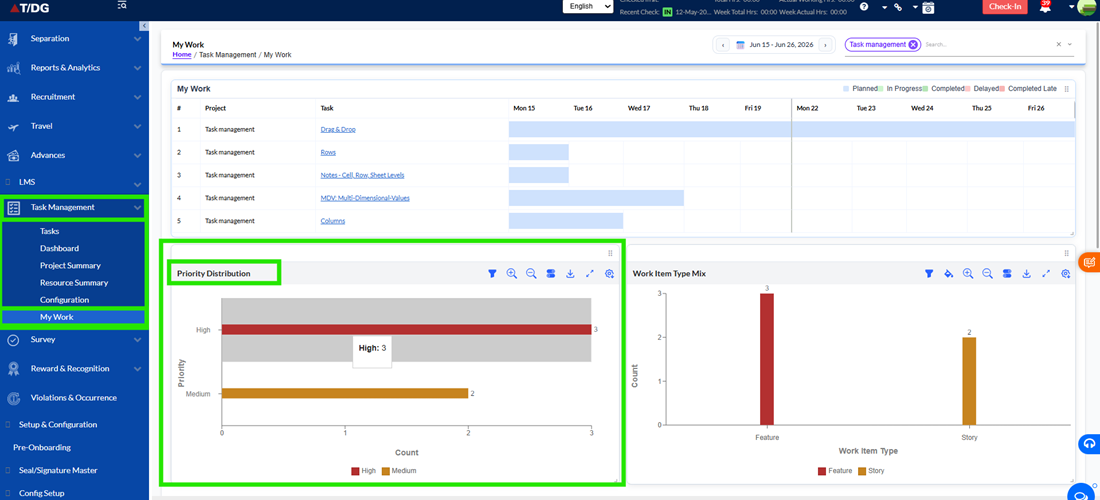
The dashboard includes a Priority Distribution chart that provides a visual representation of tasks based on their priority levels. This chart helps users understand how their workload is distributed across different priorities and enables them to identify high-priority work items that may require immediate attention. The chart is automatically refreshed whenever the selected project or date range changes. If no project is selected, the chart displays a "No Data Available" message and no priority information is shown.
- Analysing Work Item Types
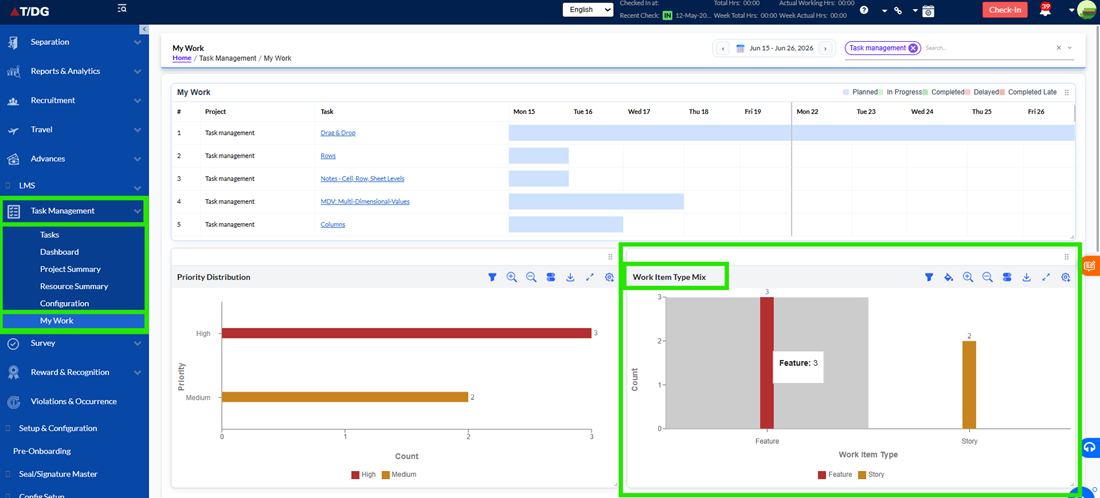
The Work Item Type Mix chart provides an overview of task distribution based on work item categories such as Epic, Feature, User Story, and Bug. This visual representation helps users understand the composition of their assigned work and identify the types of tasks they are currently handling. The chart updates automatically based on the selected project and date range filters. If no project is selected, the chart displays a "No Data Available" message and no work item type information is displayed.
- Dashboard Personalization
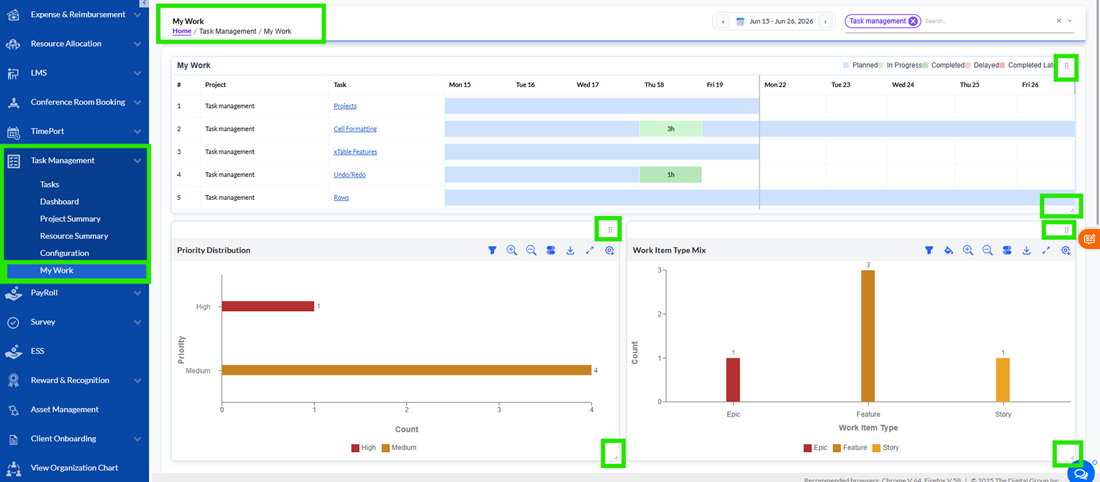
Users can customize the dashboard layout according to their preferences. Dashboard cards can be repositioned using drag-and-drop functionality and expanded or collapsed as needed. The analytical charts also support full-screen viewing, providing a more detailed view of task information when required.
The My Work Dashboard displays only tasks assigned to the logged-in user and only for projects that are currently selected. If no project is selected, the dashboard displays "No Data Available" across all dashboard components. Clicking a task hyperlink opens the Work Item Slider Panel, with the Work Log tab displayed by default. Users can navigate to the Work Item tab to review task details; however, the Work Item information is displayed in Read-Only Mode, preventing any modifications. All dashboard information automatically refreshes whenever filters are changed, ensuring users always view the most up-to-date information available.
My Team Work Dashboard
- Overview
The My Team Work Dashboard provides team leads and managers with a centralized view of tasks assigned to their team members. It enables users to monitor team workload, track task progress, review team activities, and analyze work distribution through interactive charts and reports. The dashboard helps managers gain visibility into ongoing work while supporting better planning, collaboration, and decision-making.
The page combines task schedules, team activity tracking, priority analysis, and work item analytics into a single workspace, allowing users to efficiently manage their teams without navigating across multiple screens.
- Accessing the My Team Work Dashboard
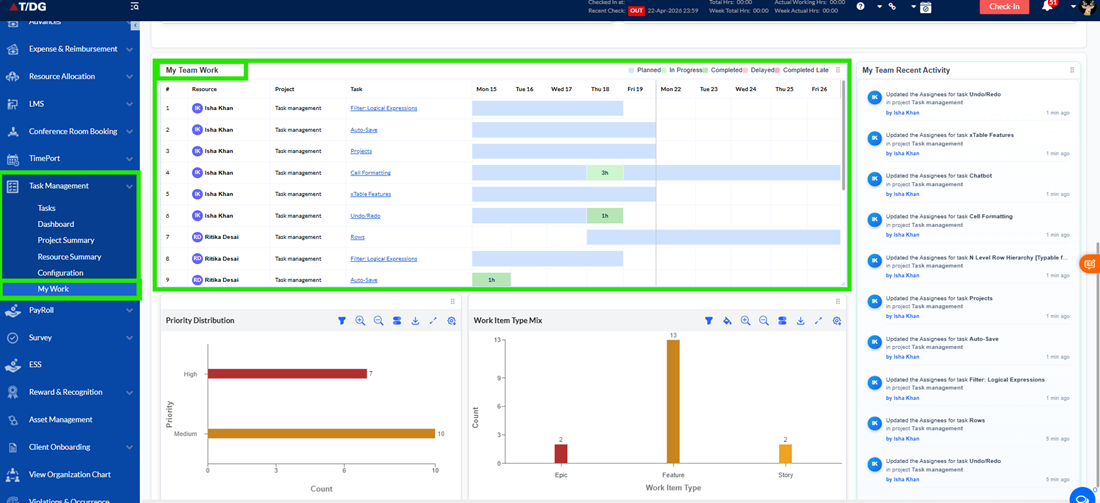
The My Team Work Dashboard is available within the Task Management module and can be accessed through the My Work section. The dashboard is visible only to users who manage one or more team members. Users without any direct reports will not see the My Team Work option.
Upon opening the page, dashboard cards display information related to the selected projects and date range.
- Filtering Dashboard Information
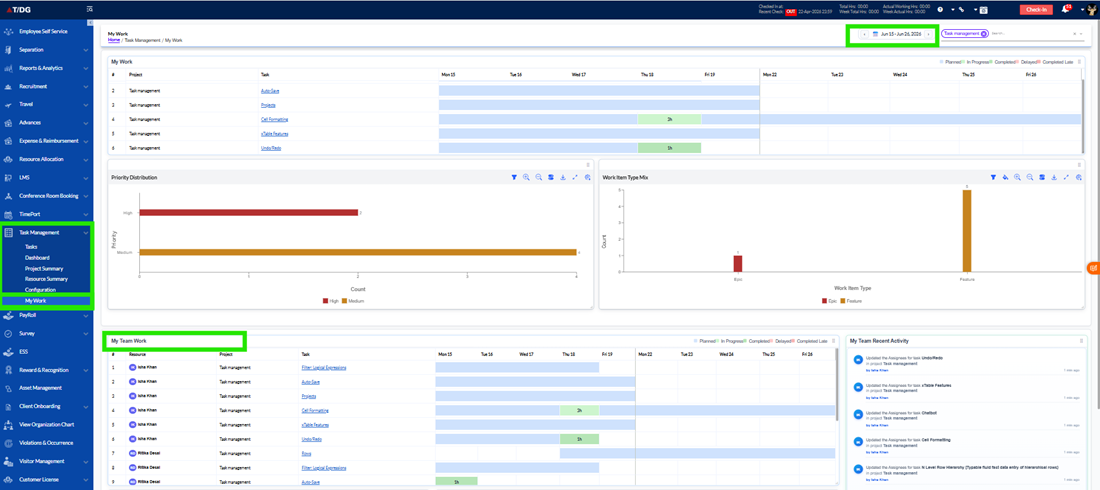
The dashboard provides filtering options that allow users to focus on specific projects and time periods. A date range selector is available at the top of the page and allows users to navigate between different time periods. By default, the dashboard displays information for a two-week period.
Users can also filter dashboard information using the Project Selector. One or more projects can be selected simultaneously, and the selected projects are displayed as tags. Whenever project selections are updated, all dashboard components refresh automatically to display information relevant to the selected projects.
A project selection is required to view dashboard data. If no project is selected, the My Team Work Gantt grid, Priority Distribution chart, Work Item Type Mix chart, and Recent Activity section display a "No Data Available" message until one or more projects are selected.
- Viewing Team Tasks
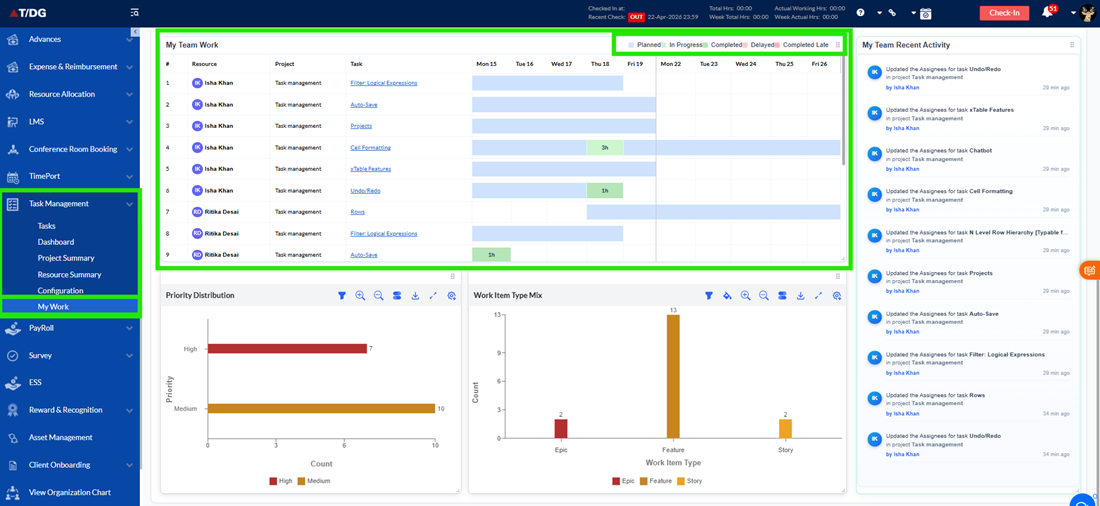
The My Team Work card is the primary section of the dashboard and provides a Gantt-style view of tasks assigned to team members. Each row represents a task and displays important information such as the assigned resource, project name, task name, and task timeline.
The timeline visually represents task schedules using colour-coded bars that indicate the current status of each task. Users can quickly identify planned, in-progress, completed, delayed, and completed-late tasks without opening individual work items.
The task name is displayed as a hyperlink, allowing users to access additional task information directly from the grid.
- Understanding Task Status Indicators
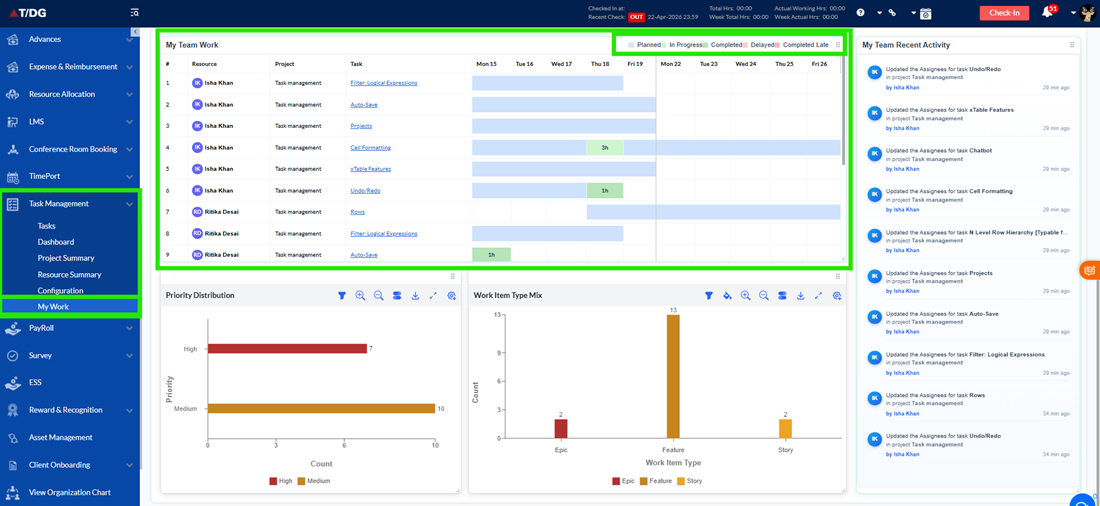
The dashboard uses colour-coded indicators to help users understand task progress at a glance. Planned tasks are displayed in light blue, active tasks are displayed in light green, completed tasks appear in green, delayed tasks are highlighted in light red, and tasks completed after their planned end date appear in red.
These visual indicators make it easier for managers to identify tasks requiring attention and monitor overall team performance.
- Managing Work Items
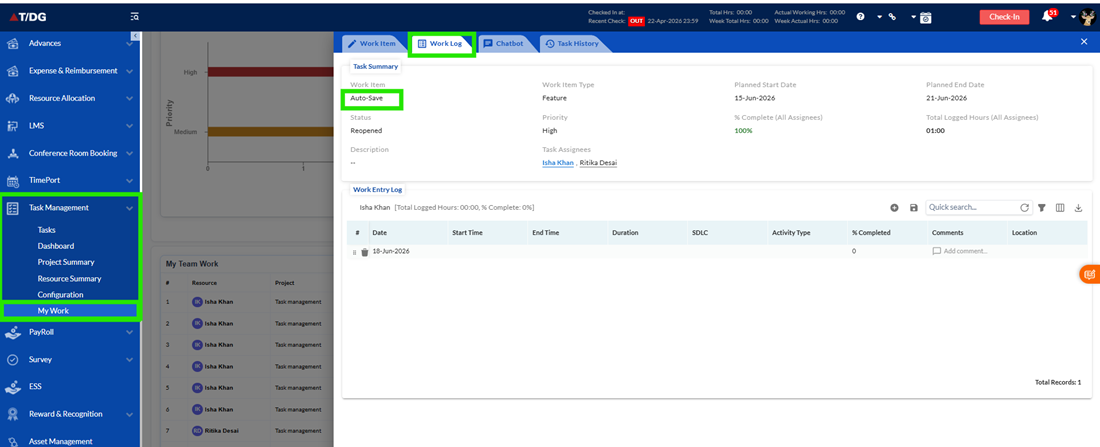
The task name displayed within the My Team Work Gantt grid acts as a hyperlink. Clicking a task name opens the Work Item Slider Panel from the right side of the screen. By default, theWork Log tabis displayed, allowing team leads and managers to immediately review work entries, logged effort, and task progress information associated with the selected task.
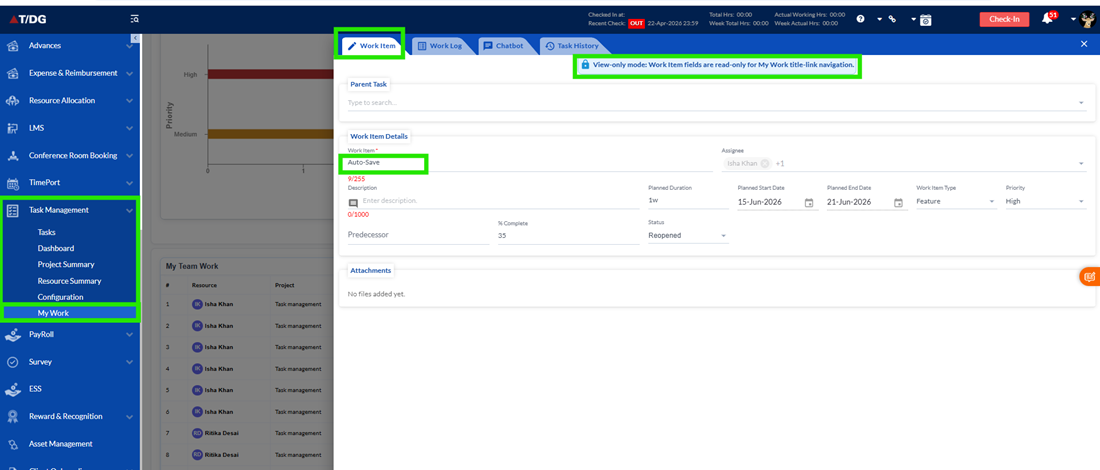
The slider panel provides access to multiple tabs including Work Log, Work Item, Chat, and Task History. Users can switch between these tabs to review different aspects of the selected work item.
When the user navigates to theWork Item tab, the task details are displayed inRead-Only Mode. Information such as task status, planned dates, completion percentage, duration, attachments, and other task attributes can be viewed but cannot be modified. All editable controls remain disabled and no update actions are available. This allows managers and team leads to monitor work item information while maintaining appropriate access restrictions.
- Viewing Work Logs
The Work Log tab is the default tab displayed whenever a task hyperlink is selected from the My Teamwork Dashboard. It provides visibility into work effort recorded against the selected task and helps managers understand resource activity and task progress. Users can review work summaries, logged hours, work descriptions, and work entry history associated with the task. The Work Log tab serves as the primary entry point when accessing task details from the dashboard.
- Collaborating Through Chat
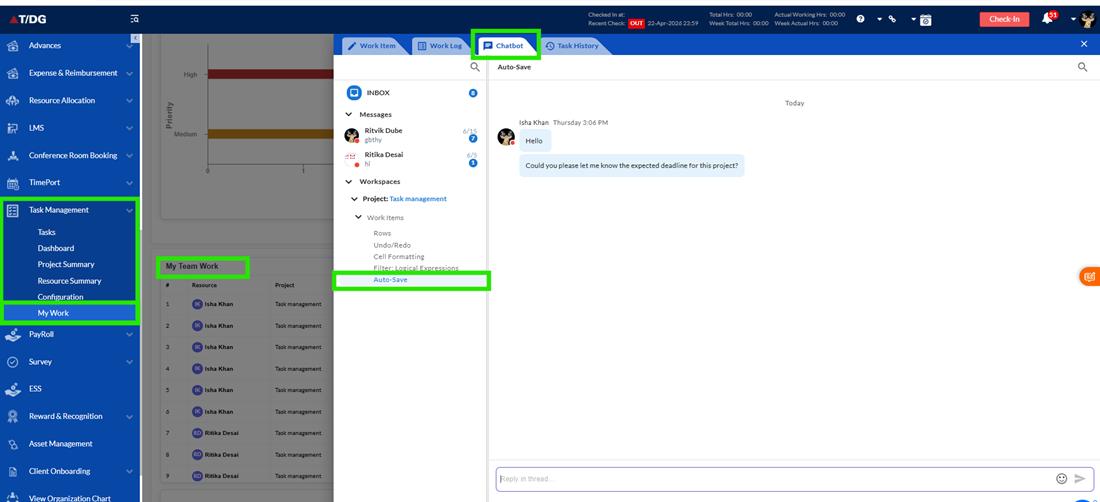
The Chat section allows team leads and managers to communicate directly with task assignees. Conversations remain associated with the selected work item, ensuring that discussions are maintained within the proper task context.
This feature helps improve collaboration, supports quick issue resolution, and keeps all communication related to a task in one location.
- Reviewing Task History
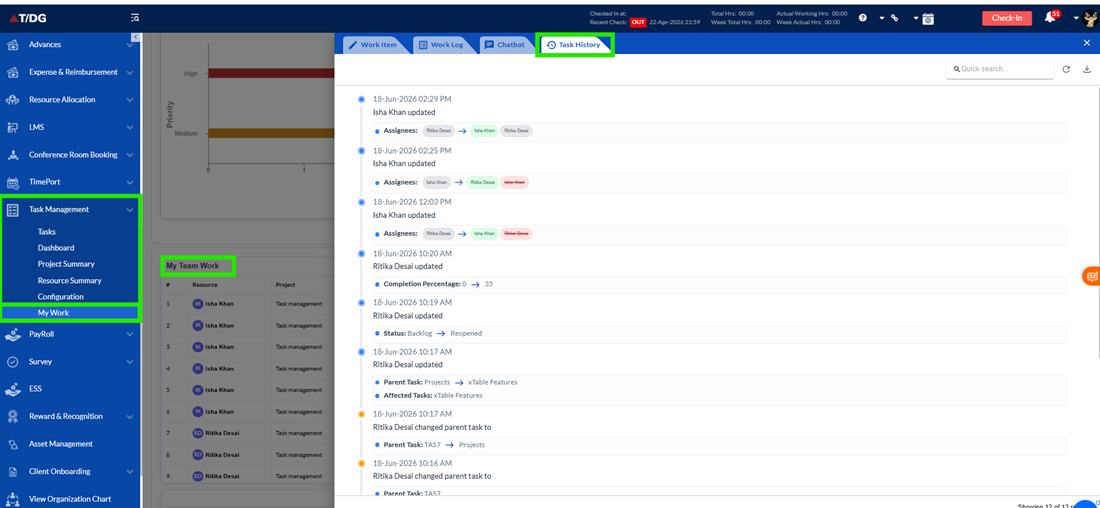
The Task History section provides a complete audit trail of activities performed on a task. Users can review updates, status changes, comments, and other modifications made throughout the lifecycle of the work item.
This information helps managers understand task progress and maintain visibility into changes made by team members.
- Monitoring Priority Distribution
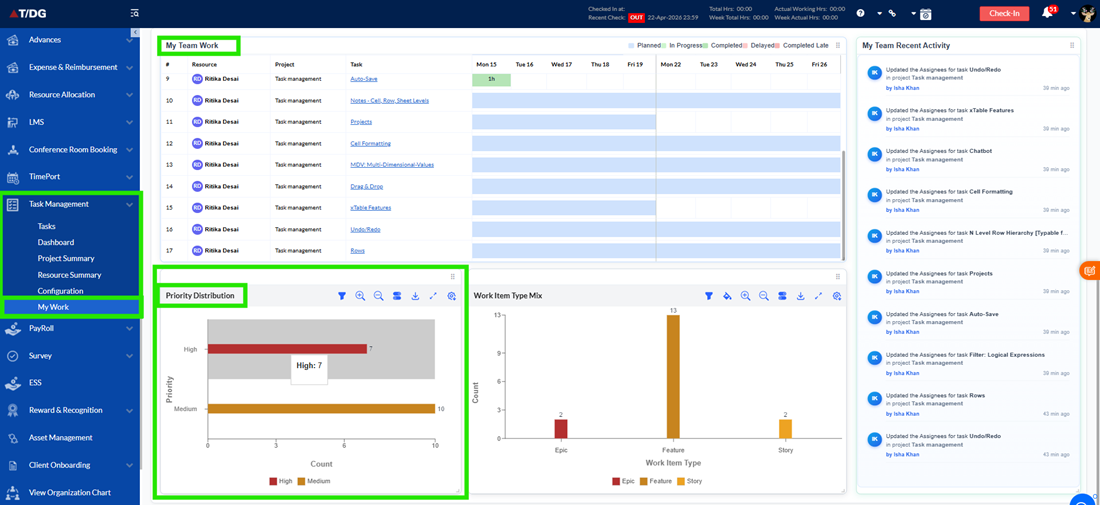
The Priority Distribution chart provides a visual representation of tasks grouped by priority level. The chart helps managers understand how work is distributed across critical, high, medium, and low-priority tasks and enables them to identify areas that may require immediate attention. The chart automatically refreshes whenever project or date range filters are changed. If no project is selected, the chart displays a "No Data Available" message and no priority-related information is shown.
- Analyzing Work Item Types
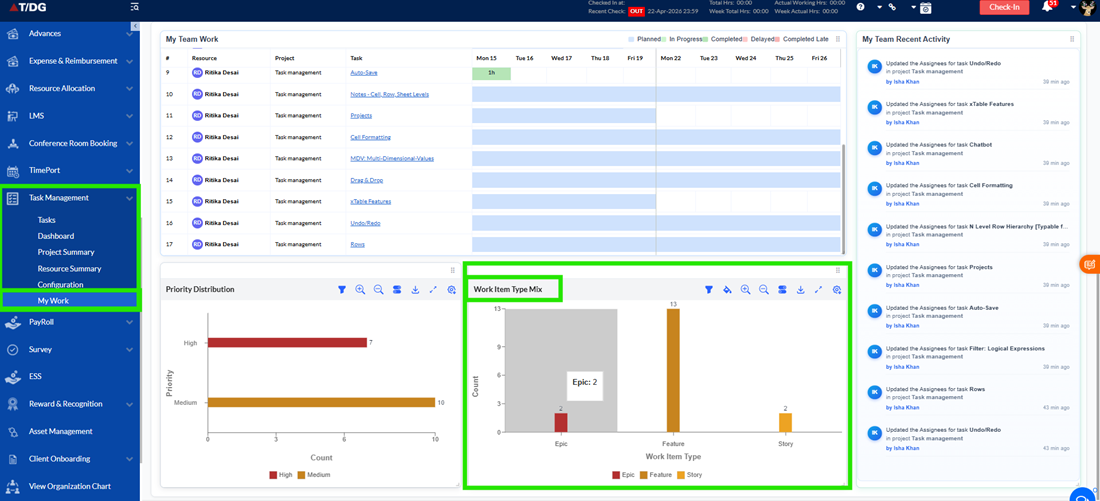
The Work Item Type Mix chart displays task distribution across work item categories such as Epic, Feature, User Story, and Bug. This chart provides managers with insights into the composition of work being performed by their teams and helps them understand project focus areas. The chart updates automatically whenever project or date range filters are modified. If no project is selected, the chart displays a "No Data Available" message and no work item type information is displayed.
- Tracking Team Activities
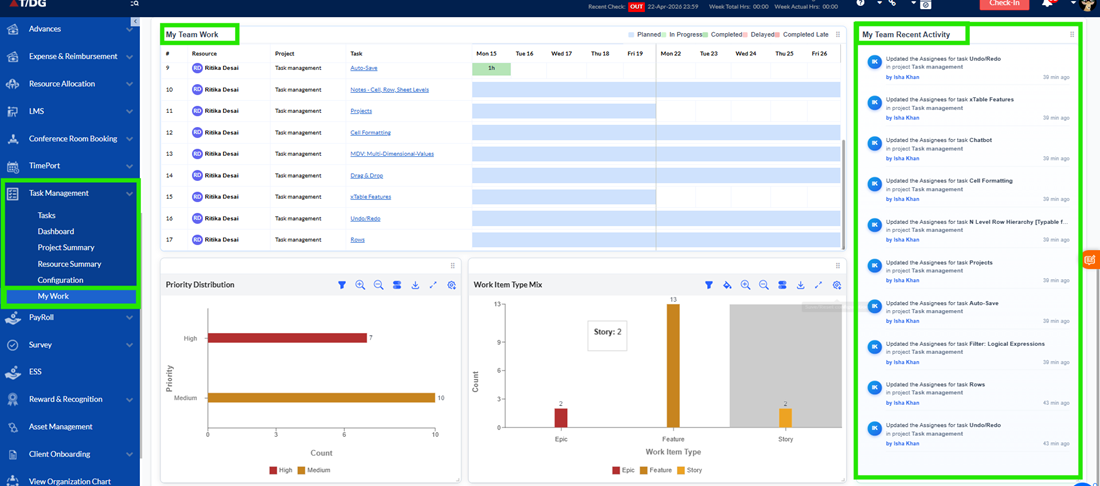
The My Team Recent Activity section provides a real-time feed of actions performed by team members. Activities such as task creation, task updates, status changes, and work item modifications are displayed in chronological order. Each activity entry includes information about the user who performed the action, a description of the activity, and the time at which the activity occurred. If no project is selected, the Recent Activity card displays a "No Data Available" message and no activity records are shown.
- Dashboard Customization
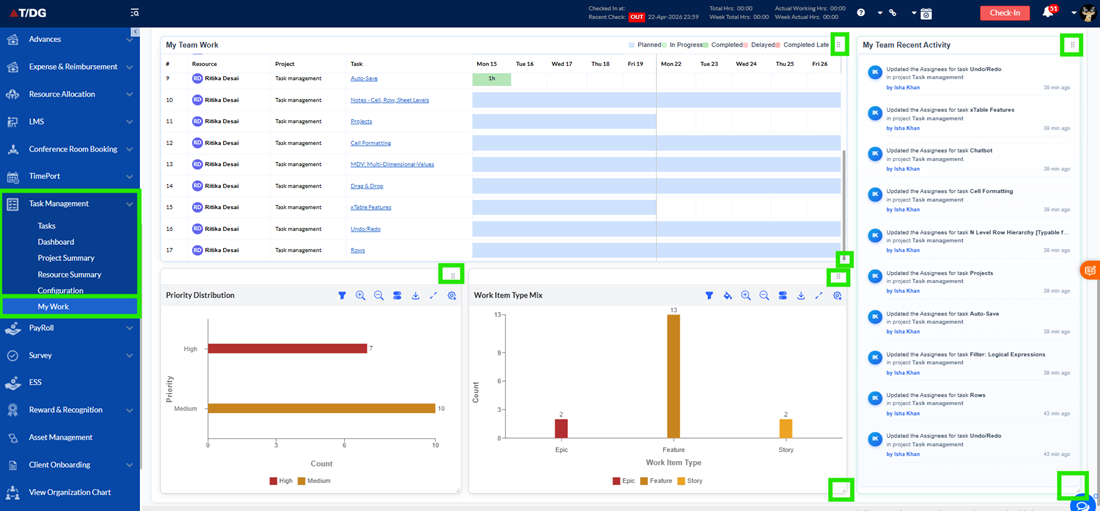
The dashboard supports flexible layout customization. Users can rearrange dashboard cards using drag-and-drop functionality to create a personalized workspace. Cards can also be resized, expanded, or collapsed according to user preferences.
These customization options help users organize information in a manner that best supports their daily monitoring and management activities.
- Data Synchronization
All information displayed within the dashboard remains synchronized across cards and reports. Whenever task information is updated, the changes are automatically reflected in the task grid, charts, and activity feed. Similarly, changes made through filters are applied consistently across all dashboard components.
This ensures that users always view accurate and up-to-date information throughout the dashboard.