TM - Project Summary
The Project Summary module provides a high-level, consolidated view of all projects within the Task Management system. It is primarily designed for managers, stakeholders, and leadership teams to monitor project performance without going into task-level details.
This screen helps users quickly understand:
- Overall project timelines
- Whether projects are on track or delayed
- Resource allocation across projects
- Total effort spent in terms of logged hours
Since this is a read-only analytical view, users cannot make any changes here. All data is automatically derived from tasks, assignments, and work logs.
Accessing Project Summary
To navigate to the Project Summary page:
Home > Task Management > Project Summary
Once opened, the page displays a grid where each row represents a project.
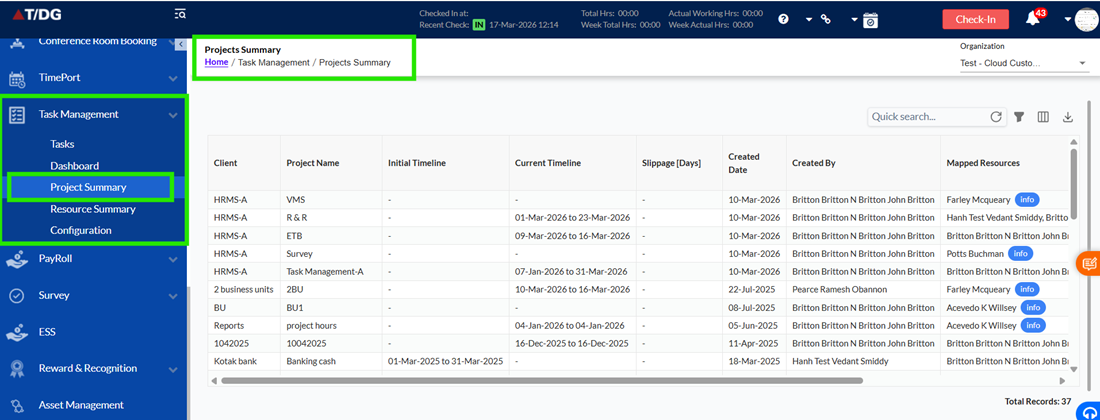
Understanding the Page Layout
The Project Summary page is designed to be simple and focused for quick analysis.
It consists of:
- A left sidebar for navigation
- A main grid area displaying project-level data
- Top-right controls for search, filters, and export
The data shown depends on the user's access permissions, ensuring users only see relevant projects.
Project Summary Grid – How It Works
Each row in the grid represents one project, providing a summarized view of its execution.
Unlike the Task Manager or Dashboard:
- No task-level details are shown
- No hierarchy or drill-down is available
- The focus is purely on project-level insights
The grid supports:
- Search
- Filters
- Column customization
- Export
Top-Right Actions (User Controls)
These controls help users quickly analyse and customize the view.
Quick Search
Users can search using keywords across all visible project fields.
- Results update instantly
- A clear (refresh) icon resets the search
Filters
Filters allow users to refine the data based on project attributes.
- Multiple filters can be applied at once
- Users can remove all filters with a single click
- The grid updates immediately based on filter conditions
Column Visibility
Users can customize which columns are visible.
- A dropdown lists all available fields
- Columns can be enabled or disabled as needed
- A search option helps quickly locate columns
This allows users to personalize the view for their specific needs.
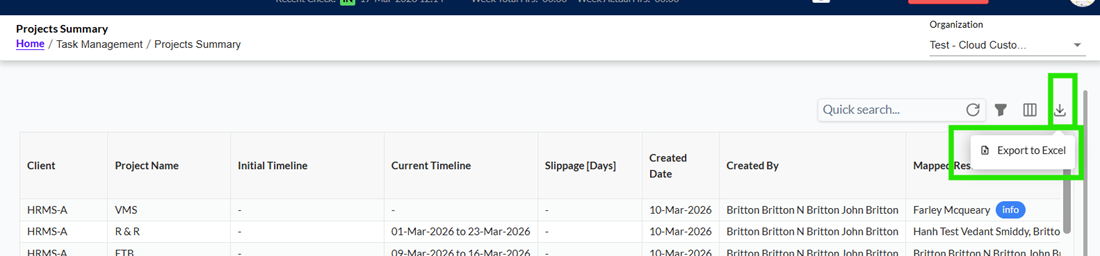
Export to Excel
Users can export the grid data into Excel.
The exported file will reflect:
- Applied filters
- Visible columns
- Active search
This ensures consistency between on-screen data and exported reports.
Understanding Project Fields
The Project Summary grid displays key information for each project:
Client
Shows the client or engagement associated with the project.
Project Name
Displays the name of the project.
Initial Timeline
Represents the originally planned start and end dates.
- Defined during project creation
- Remains unchanged throughout the lifecycle
Current Timeline
Shows the latest project timeline based on actual execution.
- Derived from all tasks under the project
- Reflects real progress
Slippage (Days)
Indicates whether the project is delayed or ahead of schedule.
- Calculated:
Current End Date – Initial Planned End Date - Positive value > Delay
- Zero or negative > On time or early
Created Date & Created By
Displays when and by whom the project was created.
Mapped Resources
Shows all resources assigned to the project.
- Displayed as tags
- If many resources exist, it shows “+X more”
- Users can view the full list when needed
Total Logged Hours
Represents the total effort spent across all tasks and resources under the project.
How Timeline and Slippage Work:
Initial Timeline
- Captured at the time of project creation
- Remains fixed and unchanged
Current Timeline
- Automatically calculated from task-level data
- Start Date > Earliest task start
- End Date > Latest task end
Slippage
- Measures the difference between planned and actual timelines
- Helps identify delays or early completion
Resource Mapping Behaviour
Resources shown in this view are:
- Derived from task assignments
- Displayed as tags for better readability
If there are many resources:
- Only a few are shown initially
- Remaining count is shown as “+X more”
This keeps the UI clean while still providing full visibility.
Footer Information
At the bottom of the grid, users can see:
- Total number of projects currently displayed
This value changes based on:
- Filters
- Search
- User access
Important Points to Remember
- This screen is completely read-only
- No editing or updates are allowed
- All values are system-generated
- Data is always in sync with Task Manager
- No task-level or hierarchy details are visible
- Export reflects the exact current view